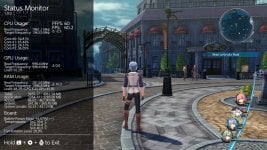
Status Monitor Overlay
This is an overlay homebrew. You need to have installed Tesla environment to use it.
Tool contains six modes to choose, each one is explained here.
It also supports modifying overlay through config file, more here.
If Tesla won't show in dock, you need to first start Status Monitor, then put Nintendo Switch to dock.
What is currently supported:
- CPU Usage for each core (Cores #0-#2 are used by apps/games, Core #3 is used by OS, background processes and also Tesla overlays)
- GPU and RAM Load
- CPU, GPU & RAM target and real frequency
- Used RAM categorized to: Total, Application, Applet, System, System Unsafe (not supported by FWs <5.0.0)
- SoC, PCB & Skin temperatures (Skin temperature not supported by FWs <5.0.0)
- Fan Rotation Level
- PFPS and FPS (With help of SaltyNX 0.7.0+. Not installing it results in not showing FPS counters on full and mini overlay)
- And more
Requirements:
- You need Tesla Menu 1.2.3+
- For additional features you need sys-clk 2.0.0_rc4 or newer + SaltyNX 0.7.0 or newer
Screenshots (from version 1.0.0):


Thanks to:
- RetroNX channel for helping with coding stuff
- SunTheCourier for sys-clk-Overlay from which I learned how to make my own Tesla homebrew
- Herbaciarz for providing screenshots from HDMI Grabber
FAQ:
Q: This homebrew has any impact on games?
A: Negligible, you won't see any difference. Almost everything is done within 1% of Core #3 at stock clocks, other cores usage is below 0.001%. Only high refresh rate for Full mode can take up to 4% of Core #3.
Troubleshooting can be find here at the end:
https://github.com/masagrator/Status-Monitor-Overlay/blob/master/README.md
Download:
https://github.com/masagrator/Status-Monitor-Overlay/releases
Repo:
https://github.com/masagrator/Status-Monitor-Overlay
This is an overlay homebrew. You need to have installed Tesla environment to use it.
Tool contains six modes to choose, each one is explained here.
It also supports modifying overlay through config file, more here.
If Tesla won't show in dock, you need to first start Status Monitor, then put Nintendo Switch to dock.
What is currently supported:
- CPU Usage for each core (Cores #0-#2 are used by apps/games, Core #3 is used by OS, background processes and also Tesla overlays)
- GPU and RAM Load
- CPU, GPU & RAM target and real frequency
- Used RAM categorized to: Total, Application, Applet, System, System Unsafe (not supported by FWs <5.0.0)
- SoC, PCB & Skin temperatures (Skin temperature not supported by FWs <5.0.0)
- Fan Rotation Level
- PFPS and FPS (With help of SaltyNX 0.7.0+. Not installing it results in not showing FPS counters on full and mini overlay)
- And more
Requirements:
- You need Tesla Menu 1.2.3+
- For additional features you need sys-clk 2.0.0_rc4 or newer + SaltyNX 0.7.0 or newer
Screenshots (from version 1.0.0):


Thanks to:
- RetroNX channel for helping with coding stuff
- SunTheCourier for sys-clk-Overlay from which I learned how to make my own Tesla homebrew
- Herbaciarz for providing screenshots from HDMI Grabber
FAQ:
Q: This homebrew has any impact on games?
A: Negligible, you won't see any difference. Almost everything is done within 1% of Core #3 at stock clocks, other cores usage is below 0.001%. Only high refresh rate for Full mode can take up to 4% of Core #3.
Troubleshooting can be find here at the end:
https://github.com/masagrator/Status-Monitor-Overlay/blob/master/README.md
Download:
https://github.com/masagrator/Status-Monitor-Overlay/releases
Repo:
https://github.com/masagrator/Status-Monitor-Overlay
Last edited by masagrator,


