


Since nobody so far has managed to figure out how to enable debugging for Wii U titles/certain threads (and shared it) I'm going to dump some information here so hopefully others can continue and complement them since it would be really useful to have breakpoints working finally. 
Alright, let's start.
By looking around in the coreinit.rpl file using IDA Pro I found a few interesting functions related to debugging and gdb. By the way, I'm using SDK version 2.13.01 from August 2015.
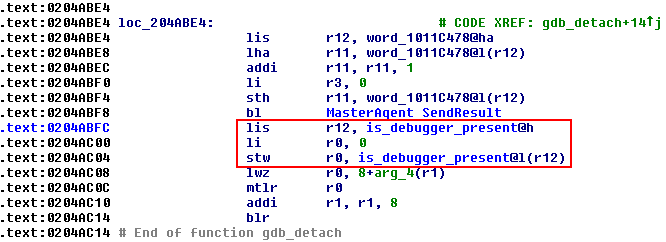
The function gdb_detach apparently detaches gdb from the process or thread which is the reverse of what we want. Still, this is not useless. Further down in the assembly of that function value 0 is written to the address which is being used to tell if a debugger is present or not so we can go ahead and rename this address to is_debugger_present:
Another hint that it is what we named it as is the function OSIsDebuggerPresent:
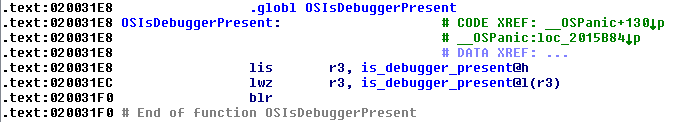
By default, it obviously returns 0 since no debugger is enabled.
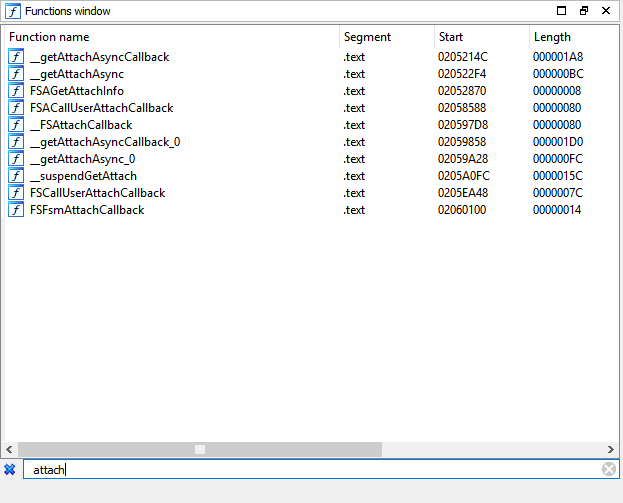
If we search for an attach function, it seems like we won't find anything useful:
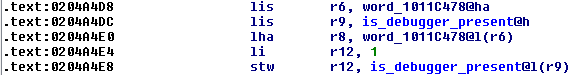
Instead, the next thing we want to do is listing all cross-references to is_debugger_present and try to find a function which sets this address' value to 1 (in order to enable it). The references are as follows:
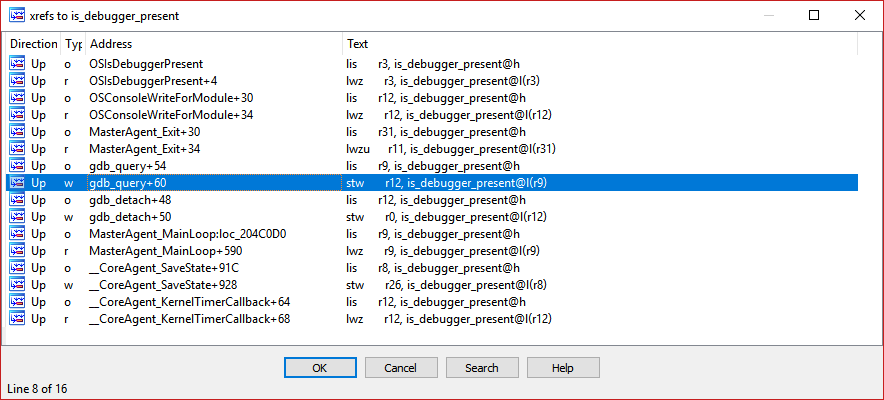
The one which is highlighted in the image is actually enabling the debugger so now we know that we probably need gdb_query:
As a side note, CoreAgent_SaveState also disables the debugger. If we inspect the beginning of the function gdb_query, we will see that it apparently takes one argument since r3 is being saved in r11 and r4, r5 and so on are all being overwritten and not kept:
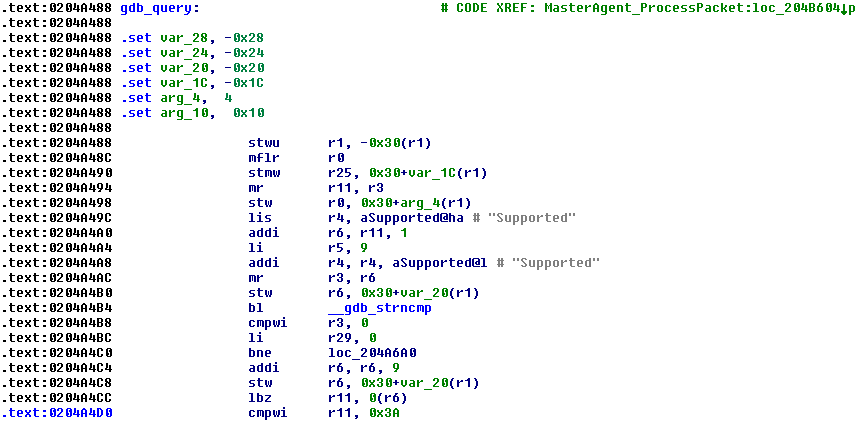
r3 is then used for a simple string comparison with the string "Supported" using gdb_strncmp. However, we will ignore the rest of this function for now.
At the top we can see that gdb_query is being called by MasterAgent_ProcessPacket. By double-clicking the XREF we can jump there. By looking at the assembly it becomes clear that the function is using some kind of switch table to decide what will happen next:
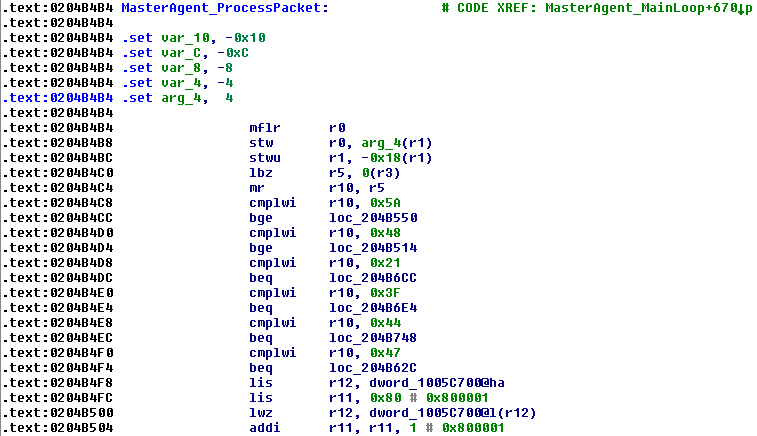
r3 is the first parameter passed to this function. r3 is an address since lbz reads a byte from it. This byte is loaded into r5 and then copied into r10 using mr. In the following, a bunch of comparisons and jumps are performed that all lead to different debugging functions hence it seems that the function signature is
If we scroll down, we will for instance see that value 0x71 leads us to gdb_query:
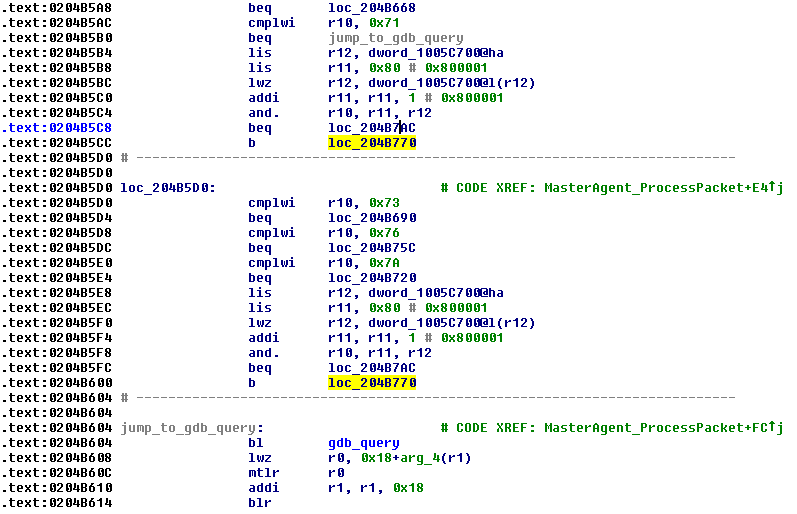
(Note: I already renamed the branch)
Okay so what about breakpoints? A search for "breakpoints" reveals two results:
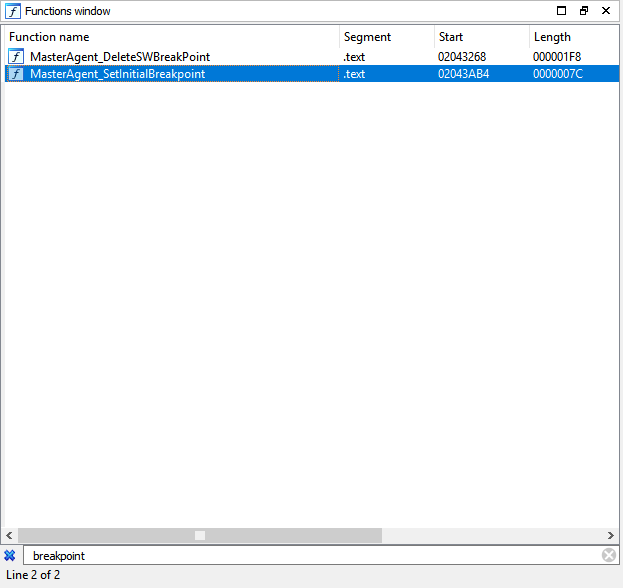
There you go, those can hopefully set and delete software breakpoints like they state. Let's check out MasterAgent_SetInitialBreakpoint:
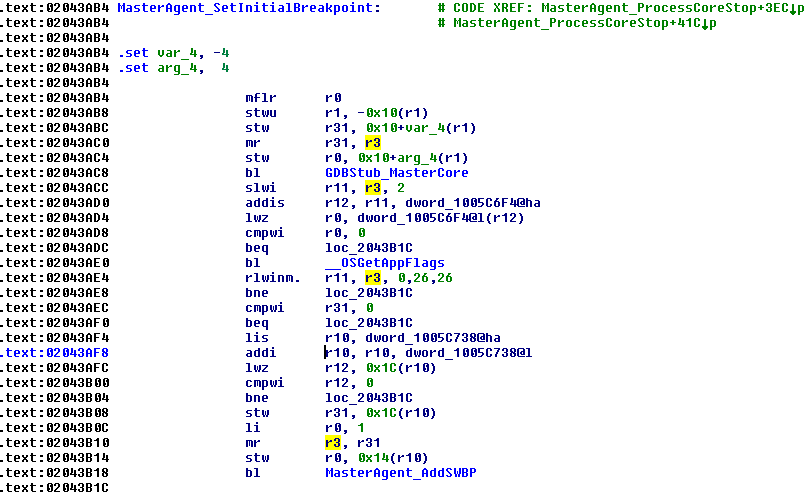
r3 is the first parameter highlighted in yellow. It seems like it's some kind of index or value but not an address since the comparison cmpwi r31, 0 wouldn't make sense on an address just like shifting (slwi) or rotating (rlwinm.). MasterAgent_AddSWBP is called further down using the same argument which really seems to really add the breakpoint. However, it calls MasterAgent_AddrToSWBPHash which again suggests that r3 is an address after all.
Anyway, I hope you liked this post and if you managed to follow till here congrats. I hope some people will find this useful and contribute to making a debugger client implementation, be it in pseudocode or a "real" language.
@QuarkTheAwesome
@CosmoCortney
@Mega-Mew
@NWPlayer123
@Marionumber1
@MrRean
@Mathew_Wi
@Maschell
@gudenaurock
Alright, let's start.
By looking around in the coreinit.rpl file using IDA Pro I found a few interesting functions related to debugging and gdb. By the way, I'm using SDK version 2.13.01 from August 2015.
The function gdb_detach apparently detaches gdb from the process or thread which is the reverse of what we want. Still, this is not useless. Further down in the assembly of that function value 0 is written to the address which is being used to tell if a debugger is present or not so we can go ahead and rename this address to is_debugger_present:
Another hint that it is what we named it as is the function OSIsDebuggerPresent:
By default, it obviously returns 0 since no debugger is enabled.
If we search for an attach function, it seems like we won't find anything useful:
Instead, the next thing we want to do is listing all cross-references to is_debugger_present and try to find a function which sets this address' value to 1 (in order to enable it). The references are as follows:
The one which is highlighted in the image is actually enabling the debugger so now we know that we probably need gdb_query:
As a side note, CoreAgent_SaveState also disables the debugger. If we inspect the beginning of the function gdb_query, we will see that it apparently takes one argument since r3 is being saved in r11 and r4, r5 and so on are all being overwritten and not kept:
r3 is then used for a simple string comparison with the string "Supported" using gdb_strncmp. However, we will ignore the rest of this function for now.
At the top we can see that gdb_query is being called by MasterAgent_ProcessPacket. By double-clicking the XREF we can jump there. By looking at the assembly it becomes clear that the function is using some kind of switch table to decide what will happen next:
r3 is the first parameter passed to this function. r3 is an address since lbz reads a byte from it. This byte is loaded into r5 and then copied into r10 using mr. In the following, a bunch of comparisons and jumps are performed that all lead to different debugging functions hence it seems that the function signature is
Code:
MasterAgent_ProcessPacket(*byte command)(Note: I already renamed the branch)
Okay so what about breakpoints? A search for "breakpoints" reveals two results:
There you go, those can hopefully set and delete software breakpoints like they state. Let's check out MasterAgent_SetInitialBreakpoint:
r3 is the first parameter highlighted in yellow. It seems like it's some kind of index or value but not an address since the comparison cmpwi r31, 0 wouldn't make sense on an address just like shifting (slwi) or rotating (rlwinm.). MasterAgent_AddSWBP is called further down using the same argument which really seems to really add the breakpoint. However, it calls MasterAgent_AddrToSWBPHash which again suggests that r3 is an address after all.
Anyway, I hope you liked this post and if you managed to follow till here congrats. I hope some people will find this useful and contribute to making a debugger client implementation, be it in pseudocode or a "real" language.
@QuarkTheAwesome
@CosmoCortney
@Mega-Mew
@NWPlayer123
@Marionumber1
@MrRean
@Mathew_Wi
@Maschell
@gudenaurock
Last edited by BullyWiiPlaza,


