I’m truly so grateful, your reply helped me a lot. Thank you!
[EMBED content="thread-610803"][/embed]
Thanks to your advice, I used Il2CppDumper and found the `GetRunSpeed()` function.
Now that I’ve located it, how can I set breakpoints in “Breeze” to debug it?
If there are any tutorials or guides on this, I’d really appreciate it!
Thanks to your advice, I used Il2CppDumper and found the `GetRunSpeed()` function.
Now that I’ve located it, how can I set breakpoints in “Breeze” to debug it?
If there are any tutorials or guides on this, I’d really appreciate it!
1. You can help yourself by directly observing the memory with Breeze.
2. Brute force with Breeze. This takes time and it’s very likely you won’t succeed. You’ll just end up wasting time.
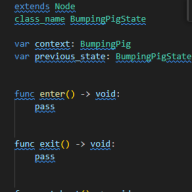
3. The safest method would be to make a dump with iL2CppDumper and manually look for where it could be. Screenshot below as an example:
View attachment 526656
Thanks to your advice, I used Il2CppDumper and found the `GetRunSpeed()` function.
Now that I’ve located it, how can I set breakpoints in “Breeze” to debug it?
If there are any tutorials or guides on this, I’d really appreciate it!
Thanks to your advice, I used Il2CppDumper and found the `GetRunSpeed()` function.
Now that I’ve located it, how can I set breakpoints in Breeze to debug it?
If there are any tutorials or guides on this, I’d really appreciate it!




















 Working with 2.0.8 upd.